Speed-to-Quote Benchmarks in Small Commercial Insurance Agencies
Faster quotes matter only if the data behind them is complete and accurate.

Most agency owners treat speed-to-quote like a simple race: faster is better, full stop. That instinct breaks down the moment the quote being accelerated is built on bad data, because a fast quote on an incomplete submission is a liability dressed up as a win.
The 2026 comparative rater ranking made this explicit, because it gave quote turnaround deliberately low weight in its scoring. The reasoning holds up under scrutiny. Commercial risk is structurally messier than personal lines. A personal auto quote needs a handful of stable data points. A commercial account carries multiple exposures, ACORD sub-apps, and supplemental questionnaires, and when intake data comes in incomplete, the damage appears downstream in ways personal lines rarely sees: declined claims, coverage gaps, E&O exposure. Speed on top of that foundation doesn't help anyone.
The more useful definition of speed-to-quote measures the time from a complete, accurate submission to a carrier-ready proposal, not the clock time from first contact to some placeholder number. That reframe changes the question this piece is built around. Time in the quoting workflow goes to stages whose work either earns its keep or just burns hours.
The commercial quoting workflow, step by step
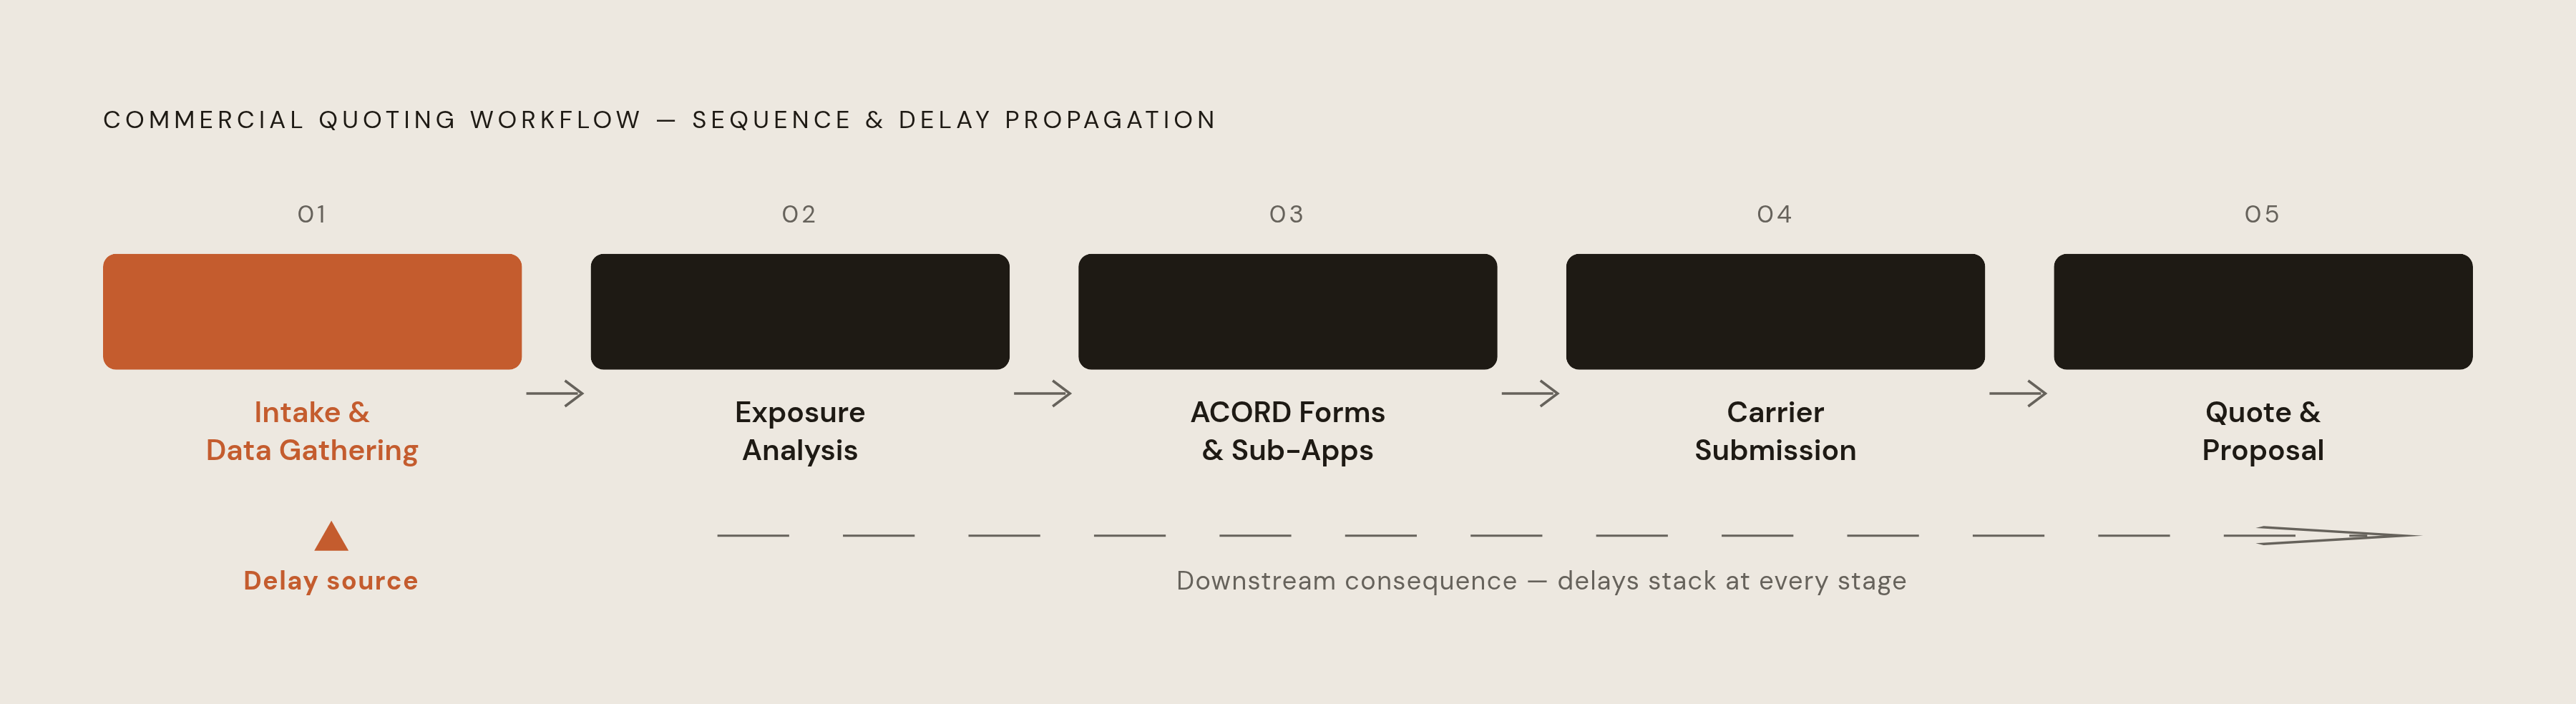
Commercial quoting runs through five stages, and each one carries its own time cost. First comes intake and data gathering, where the agency collects everything about the risk: business operations, prior coverage, claims history, property details, payroll figures, whatever the line of business demands. Next comes exposure analysis, where that raw information turns into the categories carriers actually underwrite against. From there, the work moves into ACORD form completion and sub-apps, the paperwork layer that varies by line and by carrier appetite. Then comes carrier submission, where the completed application goes out to one or more markets. Finally, quote comparison and proposal generation close the loop, so whatever comes back from carriers becomes something a client can read and sign.
Intake is the stage where things go sideways most often. Agencies juggle multiple ACORD forms, assorted sub-apps, and supplemental questionnaires that differ by carrier and by class of business. That juggling act introduces data inconsistency before rating even starts. If a gap or contradiction enters at intake, it rides through every downstream stage. Carrier submission and quote comparison each add their own delay on top of that, and because the stages run in sequence, the delays stack. A slow intake doesn't just cost time at intake. It costs time at every stage that follows it.
Benchmarks for top performers versus the middle
The gap between a strong agency and an average one is a gap in where manual work still lives inside the pipeline described above.
Start with producer output. Industry KPI data for 2026 puts mature agencies at a meaningful number of quotes per producer per week, with stronger producers climbing higher than that even while still ramping up. Bound-to-quote ratio tells a related story: healthy agencies convert somewhere between roughly a quarter and two-fifths of quotes to bound policies, and that ratio tends to decline slightly as agency size grows. Bigger isn't automatically better here. A larger agency producing more quotes isn't necessarily producing more binds relative to that volume. Raw quote count is a weak proxy for health on its own.
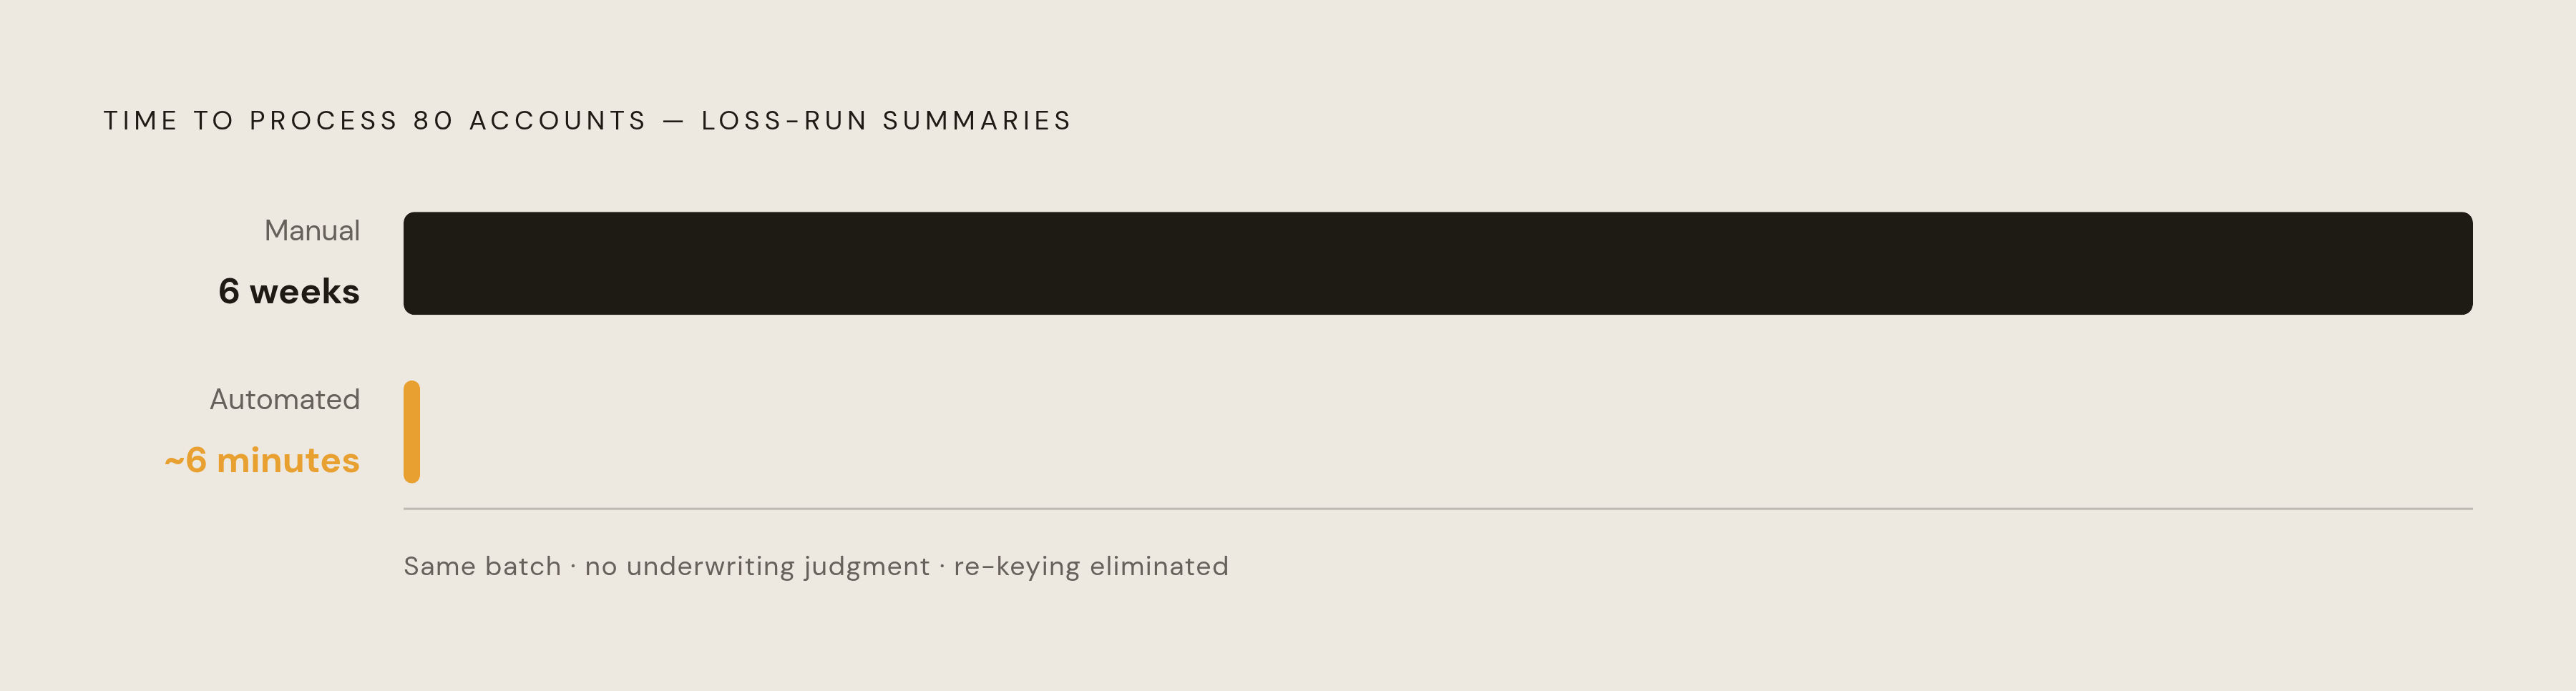
The clearest evidence sits at the submission stage. One Bold Penguin client was taking six weeks to produce loss-run summaries for roughly 80 accounts by hand. Automated extraction brought that same batch down to about six minutes. That's a structural removal of a bottleneck that had nothing to do with underwriting judgment and everything to do with manual re-keying. A separate case at the renewal stage tells a parallel story: integrating predictive tooling trained on prior renewal data sharply cut the average time spent per account at renewal.
Lining these cases up, the agencies pulling ahead aren't more talented or more disciplined. They've identified the specific point in the pipeline where a human was re-keying data unnecessarily, and they removed that step. Some will argue that faster turnaround just means more junk quotes processed at higher velocity, and that objection has teeth when automation skips intake. It loses its force when automation includes validation at the intake stage itself, because the thing moving faster is clean data, not a backlog of guesses.
Bind rate is the metric that connects quoting speed to revenue
Turnaround time matters because of what it does to bind rate, and bind rate is where the revenue case for fixing the pipeline stops being theoretical.
Insurance agency data for 2026 shows the average shopper now collects 3.5 quotes before making a decision, which is the highest number on record. In a market where buyers are comparing that many options, showing up first, fastest, and most relevant to the actual risk carries a structural edge that slower competitors simply cannot claim back later in the process. Speed at the proposal stage is the difference between being in the comparison set and being an afterthought.
The ceiling on bind rate limits how much revenue labor-hour savings alone can deliver. At a typical commission per bind, even a modest monthly lift in binds compounds into an annual gross commission uplift that dwarfs the cost of whatever automation produced it. That math is directional rather than exact, but the direction is consistent: small bind-rate improvements scale into revenue numbers that labor-cost arguments alone don't capture.
The data-quality point from the opening section comes back around here. A quote delivered fast on incomplete data tends to lose the bind the moment a client or an underwriter spots the coverage gap it was built on. A quote that comes fast on complete data closes. Speed only pays off when it's speed applied to something solid.
One more piece belongs here, even briefly: automation that removes manual re-keying also reduces data-entry error rates, and that reduction lowers exposure to coverage errors and the E&O claims that follow from them. For a risk-averse agency principal, that argument often lands harder than any cost-savings pitch, because it's framed around exposure the agency itself is carrying.
What intake's position in the quoting stack means for the rater
The comparative rater isn't usually the bottleneck in a commercial quoting workflow. The data arriving at the rater is. Fixing speed-to-quote means fixing intake before rating gets anywhere near the problem.
Static quote forms are still the dominant intake mechanism at most small agencies, and they're the primary source of both abandonment and incomplete data. A dropdown menu can't capture an "it depends" answer, and commercial risk is full of "it depends" answers: does the business store inventory offsite, has a prior carrier non-renewed the account, is there a second location not yet on the books. Forms flatten that complexity into fields that don't fit it.
Conversational intake is built to handle exactly that gap. Perspective AI runs a guided risk interview instead of a static form, so it can capture prior coverage, claims history, and property details that a dropdown-based form loses by design. The output comes out structured and feeds directly into the rater or the agency management system, rather than landing as a stack of unstructured notes someone has to translate by hand later.
The practical implication cuts against a common shortcut. When agencies automate the rating stage but leave intake untouched, they compress one part of a five-stage pipeline while the biggest time cost and the biggest data-quality risk stay exactly where they started. Rating faster on bad intake data just produces bad quotes faster.
How the commercial lines rating layer works
Once intake delivers complete, structured data, the rating platform determines how far carrier reach extends and how quickly a submission turns into a comparable set of quotes. Which platform fits depends on an agency's lines of business and its agency management system, not on any one feature standing out above the rest.
The 2026 comparative rater ranking covers several platforms, and each one suits a different agency profile. Applied Epic Quotes rates personal lines inside the AMS itself, it covers auto and home, and it fits agencies already standardized on Applied Epic as their system of record. Tarmika operates in the commercial lane, offering single-entry comparative rating across BOP, general liability, workers' comp, commercial auto, cyber, and professional liability. It fits small commercial agencies that need commercial-specific carrier reach but don't want to build custom integrations themselves.
Bold Penguin sits at a different layer. Rather than functioning as a rater in the Tarmika sense, it operates as a distribution platform powering carrier connections at scale, with billions of dollars in deduplicated small-commercial premium quoted and millions of submissions processed annually. Its agentic AI connection with Thimble, announced September 25, 2026, lets agents quote and bind with each other in natural language. The connection is designed to support broker expertise rather than replace the broker's judgment in the process.
The decision framework that falls out of this split is straightforward. Personal lines agencies tend to choose based on carrier panel breadth, because the product set is relatively standardized across carriers. Commercial lines agencies choose based on lines coverage and whether the platform handles the specific supplemental forms their carrier appetite requires, because commercial risk doesn't standardize the way personal auto does.
A realistic deployment timeline for an agency that has never automated its quoting workflow
A basic quoting automation, covering everything from intake through population into the agency management system, is achievable in under a month for an agency running a standard AMS. How far along that agency already is in its current workflow shapes how that month plays out.
Full deployment, including testing and staff training, typically runs three to four weeks. The 30-day window holds up because the scope is bounded, even though the underlying problem isn't simple. The bottleneck is a defined set of forms, fields, and carrier connections rather than an open-ended technology build, so the work has a clear edge to it from day one.
The limiting factor rarely turns out to be technical. The return on the investment depends on human adoption, and whether the system gets used accurately once it's live depends on change management and basic AI literacy among staff. A tool deployed correctly but routed around by staff who default back to old habits produces no benchmark improvement at all, regardless of how well it was built.
Compare that to the alternative timeline: hiring a person to solve the same intake or rating problem. Recruiting, onboarding, and ramp time together consume three to eight months before that hire produces reliable output, with no guaranteed outcome at the end of it. And if that hire leaves, the institutional knowledge they built walks out the door with them. A month of deployment against months of uncertain hiring is not a close comparison for an agency trying to close the gap between where it sits now and where the top performers already are.