Margin Compression Trends in SMB Professional Services Since 2020
Falling utilization and poor project data are destroying margins faster than firms can fix them.
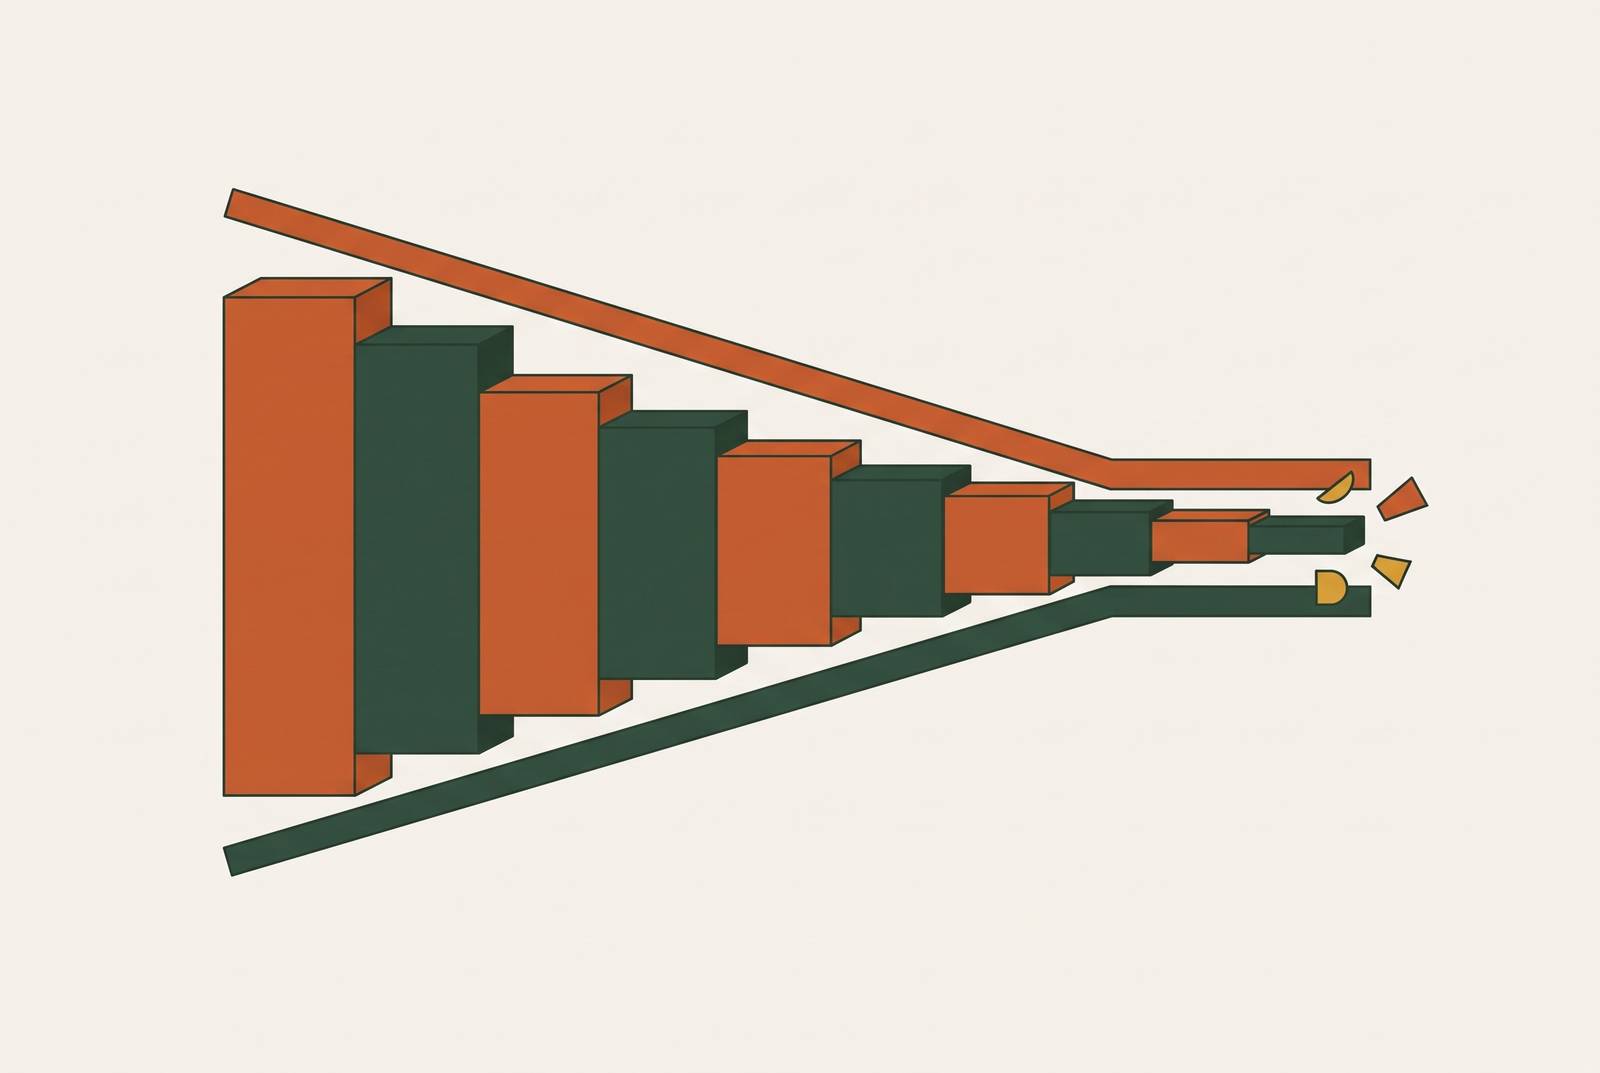
Margin compression in SMB professional services in recent years is not a passing squeeze that a better sales quarter will fix. Falling billable utilization, unreliable project data, scope creep, and rising labor costs make one another worse. To recover, firms first need to understand those links and build the habits that stop margin losses before they are recorded in the accounts.
How EBITDA fell well below its healthy five-year average — and why it has not bounced back
The industry’s EBITDA margin is now well below its healthy five-year average. That gap leaves firms with much less room between the revenue they earn and the costs they carry. For SMB professional services firms, the important point is that the industry has remained below its earlier profitability standard.
SPI Research’s 2026 Professional Services Maturity Benchmark, sponsored by Rocketlane, shows how that decline fits into what is happening across the industry. Now in its 19th annual edition, the study surveys professional services firms worldwide. It places the pressure facing smaller firms within a broader industry pattern, rather than treating it as an isolated problem at a few businesses. The average does not describe every SMB, but it establishes the scale of the challenge they face.
The distinction between a cyclical dip and a structural decline matters because each implies a different route back. A temporary shock can fade without changing how a firm runs its work. Structural pressure cannot be expected to disappear on that basis. The case for recovery therefore rests on what happens inside the business.
Why billable utilization falling to an all-time historic low is the primary engine of compression
Take a team whose pay stays the same while billable utilization drops by a single percentage point. The firm still pays for the same capacity, but it now has fewer billable hours over which to spread that cost. Dividing the same payroll by fewer revenue-producing hours raises the effective cost of every hour sold directly through the loss of billable time.
SPI Research’s 2026 Professional Services Maturity Benchmark reports employee billable utilization at its lowest level ever. Utilization moved from a high in 2021 through successive declines from 2022 through 2025. It now sits well below the 70% threshold SPI Research considers the minimum healthy benchmark. Utilization is the primary engine of compression because it changes the economics of delivery before any other cost moves.
The pressure does not stop at a higher cost per hour. Firms under margin pressure cut rates to win bids, so those hours bring in less revenue. That creates a feedback loop in which capacity becomes more expensive to sell just as the firm accepts less for it. On paper, raising billing rates may seem the obvious way out. In practice, the pressure to secure work resists those increases at the moment they are most needed.
Deltek’s discussion of the SPI 2026 benchmarks says that cautious clients, longer sales cycles, and slow decisions still hold back revenue. Those delays help explain why even a healthy backlog does not guarantee healthy utilization. Work in the pipeline and hours that can be billed now are not the same thing.
How inaccurate time data and scope creep silently destroy project economics that look healthy on paper
Low utilization is damaging enough when the firm measures it correctly. When the underlying time data is wrong, the business can also misjudge what its projects cost. Deltek’s “project profitability myth” describes the central problem. Individual engagements can appear profitable while the firm as a whole loses ground. The reassuring project report and the weakening company margin are not necessarily contradictory, because the report may rest on incomplete information.
The first error enters at the pricing stage. Inaccurate utilization rates can lead a firm to bid too low because the price does not reflect the cost of the capacity required. The proposal can look sound without providing enough room for the work the team will actually perform.
Scope creep then compounds the error by consuming hours that were never budgeted. Those hours add to the effort required without a matching allowance in the original project economics. They also reduce billable utilization, because time spent doing extra work is not automatically time that produces extra billings. A busy team can therefore give a false sense of reassurance.
Resource burndown reveals another part of the same problem. It measures the rate at which allocated capacity is consumed against plan, but most firms do not track it closely enough to catch trouble while there is time to correct it. Without that view, a stable headcount and a healthy pipeline can coexist with losses across engagements.
Deltek identifies granular time data and profitability tracked by client and project as essential to closing this gap. That visibility also helps distinguish project types the team executes well from those that merely look attractive in a proposal. TSIA’s survey, cited by Deltek, found that none of the larger companies it surveyed used Professional Services Automation for project management, even though PSA tools were available for revenue management and billing. The distinction matters because producing a bill and controlling the work behind it are different tasks.
Why rising labor costs hit SMB professional services firms harder than they hit larger competitors
Rising labor costs make these weaknesses more expensive, but the burden is not equal across firms. A smaller business has fewer ways to absorb an increase without changing its prices or its delivery capacity. Its vulnerability comes from that lack of room. The same pressure can therefore demand a much harder choice from an SMB than from a larger competitor.
A 30-person services firm facing material increases in labor and overhead cannot respond like a large firm. It cannot self-insure or cross-subsidize the pressure from higher-margin divisions. Nor can it postpone the problem through headcount reduction without damaging delivery capacity. The people on the payroll are also the people needed to complete client work. Reducing that expense can weaken the firm’s ability to earn the revenue meant to cover it.
That leaves a blunt choice when costs cannot be absorbed. The firm can raise prices and risk losing clients to competitors willing to discount. Or it can hold rates and accept further margin erosion. The squeeze remains either way, and the utilization feedback loop makes it harder to raise prices.
Even if a firm understands its costs, its options remain narrower than those of a competitor with more financial room. Accurate costing can expose which work is covering its share and which work is deepening the problem. For a smaller firm, that distinction is central to protecting scarce delivery capacity.
What the gap between high-performance firms and the rest reveals about which firms escape the spiral
The pressures are widespread, but their results are not uniform. SPI Research’s 2026 Professional Services Maturity Benchmark shows high-performance organizations earning EBITDA well above the industry average, while the lowest-maturity firms operate at negative EBITDA. The spread between the top and bottom maturity levels is dramatic and growing. That split challenges the idea that the whole industry is simply waiting through the same downturn. Some firms have the operational means to catch problems that others discover only after the margin has gone.
SPI Research’s maturity model covers five pillars, namely leadership, client relationships, talent, service execution, and finance and operations. Its important finding is that strength in one pillar does not compensate for weakness in another. Firms that get ahead improve all five together. The advantage is therefore not a single strong department or an isolated improvement. It comes from the way the business manages clients, people, delivery, and money as connected parts of the same operation.
Project margins show the same divide. SPI Research’s benchmark places T&M project margins at high-performing organizations materially above those of the rest of the field. Level 1 firms run project margins well below the industry average, while Level 5 firms run well above it. That supports the structural explanation because the gap appears within delivery economics. Higher maturity is associated with better control of the work from which profit must come.
For SMBs, the useful lesson is to understand what makes the pressures less destructive for some firms. High-maturity organizations have systems in place to spot and fix utilization, data, and cost problems. Low-maturity firms cannot see those problems early, so they lose margin before the problems become clear. The widening gap makes visibility and control more important than a firm’s confidence that its pipeline or project reports look healthy.
Why accurate operational data and workflow discipline are the preconditions for any margin recovery
The route back begins with a clearer account of how work turns into profit. Deltek argues that a sharp focus on project profitability is the best bet in tough times. That requires knowing in real time which projects and clients contribute margin and which consume it. For utilization, the point is to connect billable activity to the economics of delivery. More activity is not enough if the firm cannot see what that activity earns.
For data and scope failures, Deltek identifies minimum capabilities that include granular time data, profitability by client and project, and scenario pricing analysis. These allow the firm to price against a more accurate view of effort and catch scope drift before it destroys the economics of an engagement. They also connect the original estimate to what happens during delivery. Without that link, the firm can keep making choices that seem sound but rest on a wrong estimate.
Cost pressure requires a different kind of discipline from simply cutting people. The survey data described in the brief shows that most firms expect revenue growth while nearly half expect headcount to stay flat or decline. The implied task is to get more capacity from the team already in place. Automating time collection, timesheet creation, and invoicing addresses a common source of data error while reducing administrative work. That leaves more room for the judgment-intensive work that drives margin.
For SMBs, the practical opportunity is to embed AI into the workflows where those bottlenecks occur, including time capture, project cost tracking, invoicing, and scope-change alerts. The purpose is to make the visibility available to high-maturity firms accessible without six-figure consulting fees or a six-month hiring cycle. These capabilities are foundations for better decisions. Their value depends on whether they help the firm see and control the causes of loss.
SANSA’s model fits that operational need. It starts with a two-week diagnosis to find the highest-leverage AI opportunities, followed by a production-ready system and an embedded presence designed to compound value over time. The same approach delivered a dramatic reduction in data entry time for a wholesale insurance broker and hundreds of hours a month saved for a paper freight company. Those examples show time saved on administrative work and the value of fixing real workflow bottlenecks, though they do not prove a professional services margin recovery. For SMB professional services firms, the direction is clear. Recovery requires reliable information about the work and the discipline to act on it before lost hours become lost margin.